Blog ·
How many ancestors do you actually have?
Ask a child how many great-grandparents they have and they will work it out: two parents, four grandparents, eight great-grandparents. The pattern is obvious and satisfying. Keep going and the numbers do what doubling always does. Ten generations back you have 1,024 slots. Twenty generations back, over a million. Thirty generations back, about a billion.
Thirty generations is roughly the year 1100. There were not a billion people on earth in 1100. There were perhaps 300 million, and only about 50 million in all of Europe. So the arithmetic, taken literally, is impossible, and the gap between what the doubling demands and what the planet could supply is the single most important number in genealogy.
The doubling wall
Here is the collision laid out, assuming 30 years per generation and ancestry within Europe.
| Generations back | Approximate year | Ancestral slots | Population of Europe (approx.) |
|---|---|---|---|
| 10 | 1725 | 1,024 | 120 million |
| 20 | 1425 | 1,048,576 | 70 million |
| 25 | 1275 | 33,554,432 | 75 million |
| 27 | 1215 | 134,217,728 | 65 million |
| 30 | 1125 | 1,073,741,824 | 50 million |
| 40 | 825 | 1.1 trillion | 30 million |
Somewhere around 26 or 27 generations back, in the early 1200s, your slots outnumber every person alive in Europe. Before that point, the table is simply counting the same people over and over. Beyond 40 generations, each living European of the year 825 would have to occupy your tree tens of thousands of times on average, and that is roughly what happens.
Pedigree collapse
The resolution is called pedigree collapse. The slots are real as positions, but the people filling them are not all distinct. Whenever two of your ancestors were related to each other, their shared ancestors fill multiple slots at once, and the tree folds in on itself.
This starts far closer to home than people assume. If your parents were fourth cousins, which was unremarkable in any rural community before the twentieth century, then your great-great-great-grandparents on one side are the same people as on the other, and 2 of your 64 slots at that level collapse into 1. Multiply that across every cousin marriage in every branch over 25 generations and the collapse becomes total.
The number of distinct individuals in your ancestry therefore does not double forever. It rises, peaks somewhere in the late Middle Ages, and then falls as it approaches the size of the actual ancestral population. For a typical European, the peak is probably a few million distinct people somewhere around the 1200s to 1400s, after which the count declines toward the few tens of millions of people who were alive in Europe around the year 800 and left descendants.
The surprising width
Here is the less intuitive part. Collapse does not make your ancestry narrow. It makes it wide.
Because the slots are being filled over and over, nearly everyone in the ancestral population who left descendants ends up in your tree somewhere. The statistician Joseph Chang showed in 1999 that in a mixing population the most recent common ancestor of everyone alive is only a few dozen generations back, and that a few generations beyond that, every person who has any living descendants is an ancestor of everyone. Chang, Rohde, and Olson refined this in 2004 using a model with realistic geography and migration, and put the European all-common-ancestors point somewhere around 1,000 to 1,500 years ago.
So the answer to “how many ancestors do you have in the year 800” is not “a trillion” and not “a few.” It is “approximately every person alive then who has descendants.” Your tree, at that depth, is the population.
The people who are nobody’s ancestor
The same simulations deliver a second finding that most people never hear. In any past generation, a large share of individuals have no living descendants at all. Their children died, or never had children, or their grandchildren’s lines dwindled to nothing. Over spans of a thousand years, the fraction of people whose lineages went extinct is substantial, often estimated in the range of a third to a half.
This creates a sharp division. Of the roughly 30 million Europeans alive in 825, perhaps half left no one. The other half are the ancestors of literally every European alive today. There is no middle category. You cannot be the ancestor of some living Europeans and not others, not at that depth, because the mixing has had too long to run.
What is actually in your tree
Pulling the threads together, a realistic picture of your ancestry looks like this.
Back to about seven generations, roughly the year 1800, your slots are mostly filled by distinct people, and you can hope to name a fair number of them. Between seven and about twenty generations, collapse accelerates, distinct ancestors still rise in number but more slowly, and the documents thin out. Past about 25 generations, the distinct count turns around and starts to fall, and your ancestry converges on the entire reproductive population of your ancestral region. By 40 generations it is, for practical purposes, everyone in Europe who had grandchildren.
The number of distinct ancestors you have ever had, across all generations combined, is therefore not infinite and not trillions. It is bounded by the number of humans who have ever lived and left descendants, which is itself a minority of the roughly 100 billion people who have ever existed.
Running the model yourself
You do not have to take the simulations on faith. The simplest version of Chang’s model is small enough to run on a laptop. Start with a population of some fixed size, say 10,000. Each generation, give every new individual two parents chosen at random from the previous generation. Then pick one person in the present and trace all their ancestors backward, counting how many distinct individuals appear at each depth.
What you see is exactly the curve described above. For the first ten or so generations the distinct count nearly doubles each step. Then it bends, as the slots start landing on the same people. Somewhere around log₂ of the population size, 13 or 14 generations for 10,000 people, the count levels off at a fraction of the population. Keep going and you find that every person at that depth is either an ancestor of everyone in the present or an ancestor of no one, with the split falling near 80/20 in the simplest model.
Rohde, Olson, and Chang’s 2004 version added continents, oceans, migration rates, and realistic mating patterns, which pushes the dates back by a factor of two or three compared with the random-mixing case. It is the geography that puts the European all-ancestors point around 1,000 to 1,500 years ago rather than a few centuries.
Why this is good news
Genealogists sometimes hear this and feel cheated, as if the hobby had been exposed as a counting error. The opposite is true. The doubling illusion makes ancestry seem like a private tree with you at the trunk. Collapse reveals it as a shared web in which you and your neighbor, and the stranger on the train, converge on the same medieval population within a few dozen generations.
It also tells you where the real work is. The region between you and the year 1600 is where ancestors are still distinct, still nameable, and still findable in records. That is where a family tree is a map of actual individuals. Beyond that, you are no longer tracing a tree. You are tracing a population, and the only honest way to draw it is to write “everyone” at the top.
Sources
- Chang, J. T. (1999). “Recent common ancestors of all present-day individuals.” Advances in Applied Probability 31(4): 1002–1026.
- Chang, J. T. (1999). “Reply to discussants.” Advances in Applied Probability.
- Rohde, D. L. T., Olson, S., and Chang, J. T. (2004). “Modelling the recent common ancestry of all living humans.” Nature 431: 562–566.
- ScienceDaily summary of Rohde et al.
- “Recent Common Ancestors: Simple Model”: an R implementation of Chang’s model.
- Coop, G. (2013). “How many genetic ancestors do I have?”
- Historical population figures for Europe are approximate, drawn from standard estimates (McEvedy and Jones, Atlas of World Population History).
Image credits
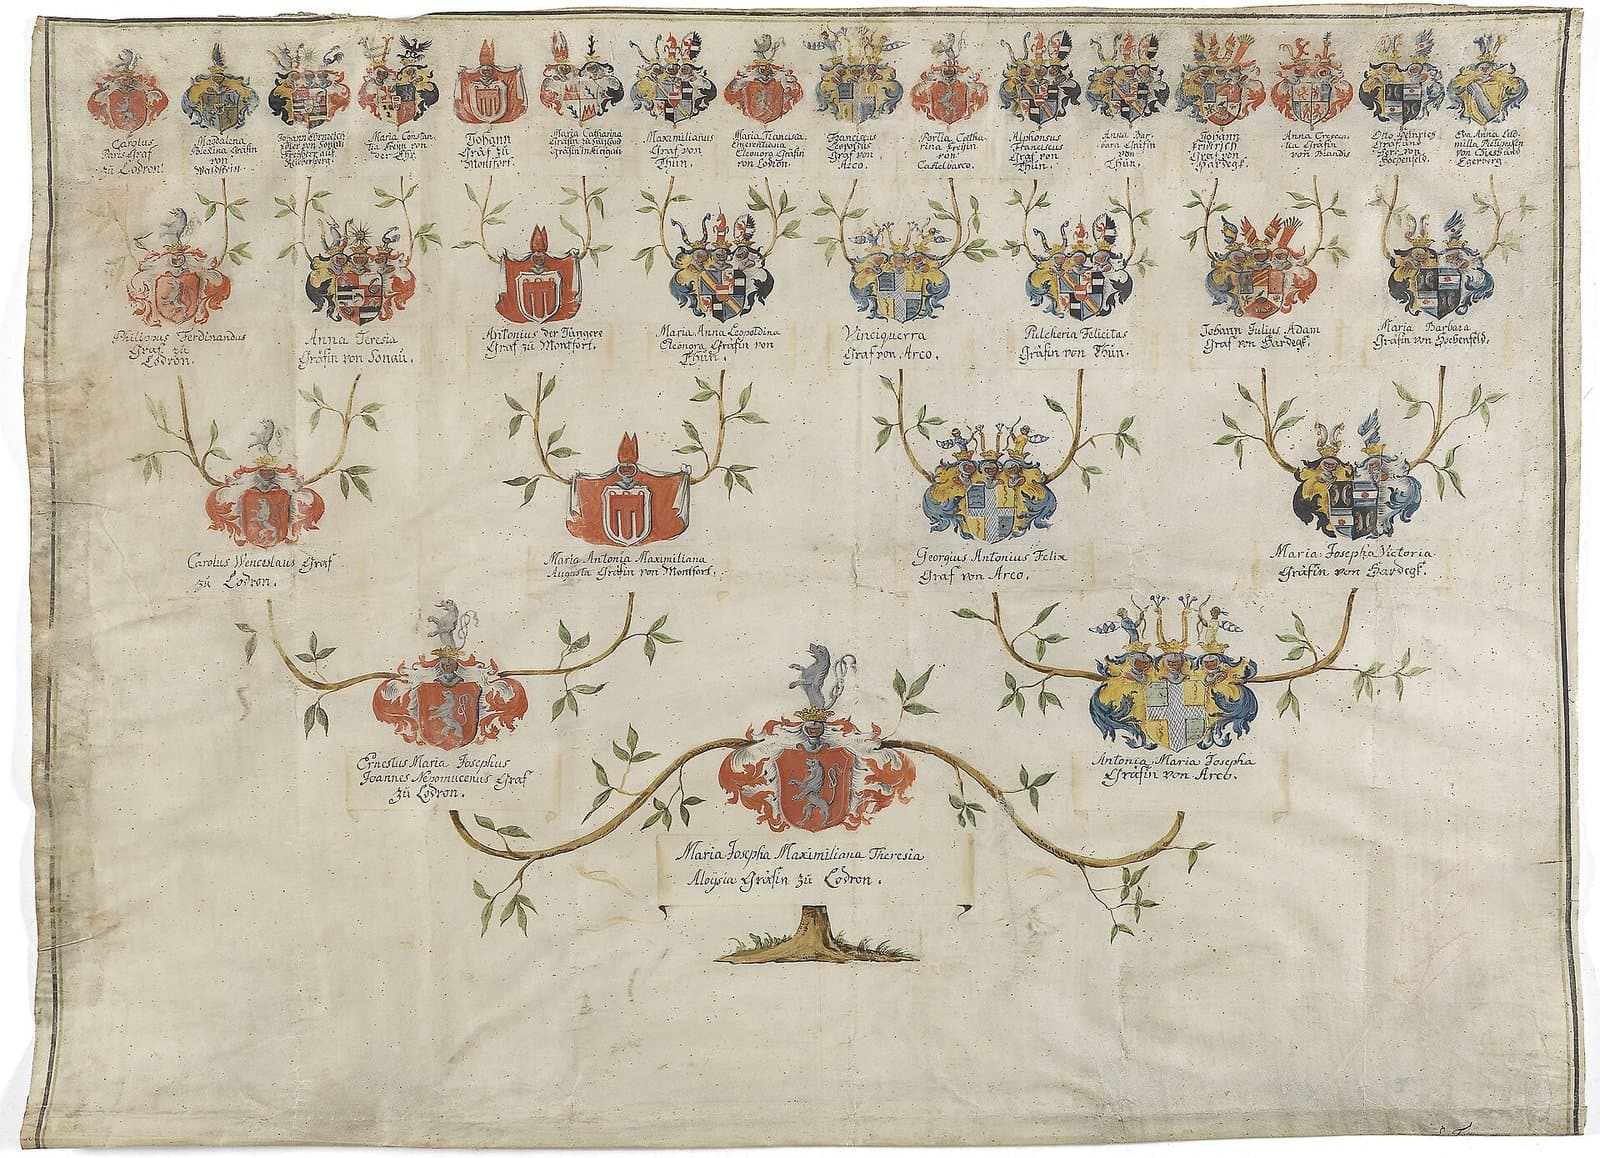
- Ahnenprobe of Maria Josepha Maximiliana, Countess of Lodron (1786). Wikimedia Commons, Public domain.
