Blog ·
Why your DNA test doesn’t match your family tree
Here is a scenario that plays out thousands of times a week. Someone spends years building a family tree. Every link is sourced: baptismal records, census pages, a will from 1790. The tree shows a great-great-great-grandmother who came from Ireland. Then the DNA kit arrives, and the ethnicity estimate says 0% Irish. The tree-builder stares at the screen and wonders which one is lying.
Usually, neither. The tree is correct and the DNA is correct, and the reason they disagree is one of the least intuitive facts in all of genetics.
You do not inherit from all your ancestors
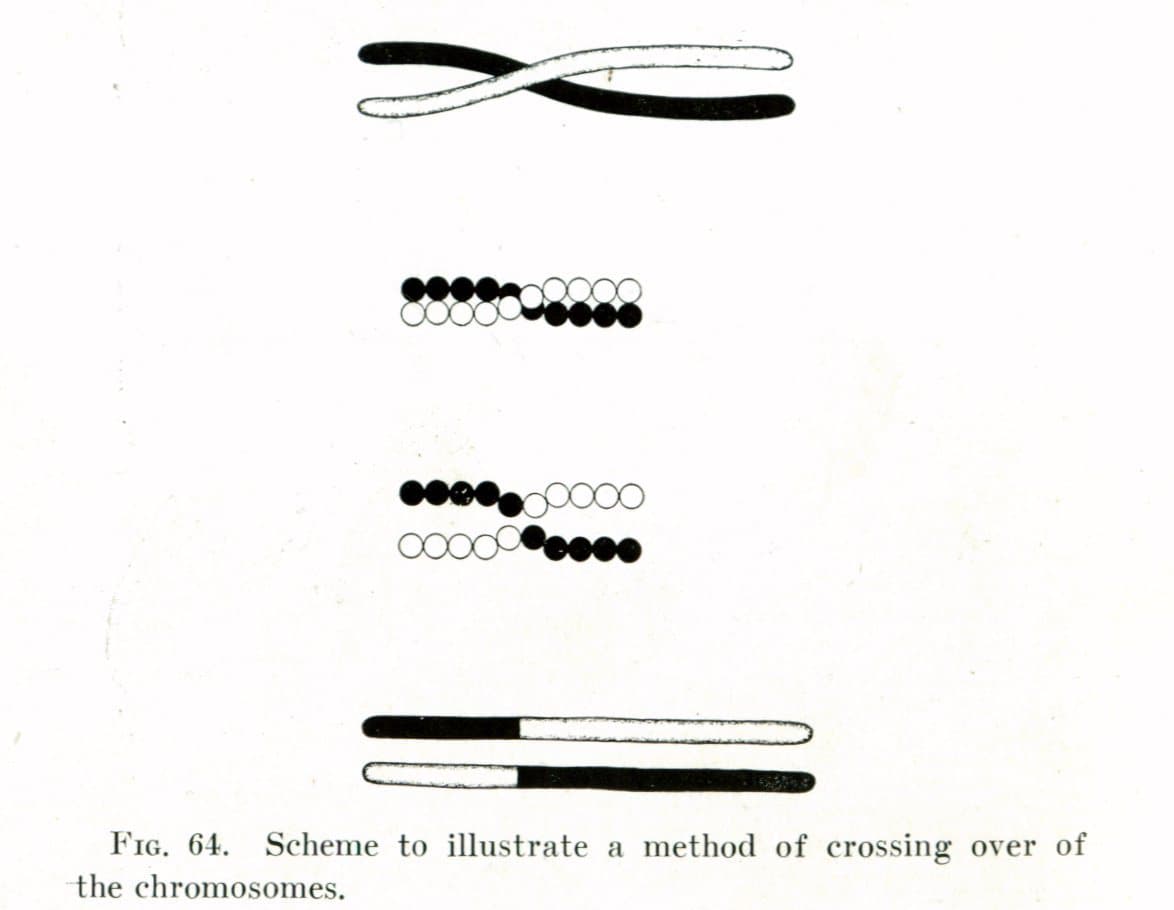
Think about where your DNA actually comes from. You get half from each parent. Each parent got half from each of their parents, but the half they passed to you was not an even quarter from each grandparent. It was a random shuffle. Chromosomes are cut and recombined during the formation of egg and sperm, and which segments survive the cut is a matter of chance.
At the grandparent level the randomness is mild. You will almost certainly carry around 25% from each, give or take a few points. At the great-grandparent level the spread widens. By the time you reach your great-great-great-great-grandparents, 64 people, the expected contribution from each is about 1.6%, but the actual contribution follows a distribution that has a meaningful bump at zero.
In other words, some of your 64 ancestors at that generation contributed nothing to you at all. Not a tiny amount. Nothing. They are in your pedigree, documented and real, and yet no segment of your genome descends from them.
The seven-generation cliff
Graham Coop, a geneticist at UC Davis, worked out the numbers in a widely shared analysis. The probability that a given ancestor contributes zero DNA to you is near zero for grandparents and great-grandparents, around 1% at five generations, roughly 10% at seven generations, and over half by nine or ten generations. By the time you are looking at ancestors from the 1600s, the typical person carries DNA from only a minority of them.
Flip that around. At ten generations back you have 1,024 ancestral slots. You probably carry measurable DNA from a few hundred of those people at most. The rest are genealogical ancestors but not genetic ancestors. The distinction is real and the terms are worth learning, because the whole confusion comes from assuming the two lists are the same.
This is why the Irish great-great-great-grandmother can vanish. If she is the only Irish line in your tree and she sits six generations back, there is a decent chance that the lottery of recombination simply did not pass any of her segments down to you. Your sibling might have inherited 3% from her. You got none. Both of you are her descendants.
Ethnicity estimates are not pedigrees
The second source of mismatch is what an ethnicity estimate actually measures. The companies compare your DNA to reference panels, groups of present-day people who report four grandparents from the same region. They then estimate which panels your segments most resemble. This has three built-in problems.
It measures the present, not the past. The reference panel for “Ireland” is made of people living in Ireland today. If your ancestor left Ireland in 1750, her DNA was shaped by the Irish population of 1750, which differed somewhat from the modern one.
It cannot distinguish neighbors well. Irish, Scottish, and Welsh DNA overlap heavily, as do German and Dutch, or Polish and Ukrainian. A segment the algorithm assigns to “Scotland” may in fact be Irish. Different companies draw the borders differently, which is why the same person gets different results from different kits.
It reports percentages that look precise and are not. “12% Scandinavian” is a probabilistic estimate with a wide error bar, and the companies revise their algorithms every year or two. People who tested in 2017 have watched their results shift by ten or fifteen points without any change in their actual DNA.
A worked example
Suppose your tree shows sixteen great-great-grandparents, four generations back, and your test shows ancestry from only three of the four regions they came from. Four generations is close enough that zero inheritance from any one of them is unlikely, around 1 in 100 per ancestor by Coop’s figures. So an entire missing region at that depth is a signal worth taking seriously: either the label is being absorbed into a neighbor, or one of those sixteen paper links is not a biological one.
Now move the same problem back to the eighth generation, 256 ancestors. Here roughly one in five contributes nothing. If a single ancestor at that depth carried the only Polish line in your tree, there was always a fair chance you would show no Polish ancestry at all, and the tree needs no correction. The rule of thumb is that missing ethnicity becomes expected, rather than suspicious, somewhere between the sixth and eighth generation.
Companies also report shared centimorgans, the unit of matching DNA. A documented third cousin should share roughly 50 to 100 cM with you. If a confirmed third cousin shares zero, something in the paper trail between you is not biological. If they share the expected amount, the two trees are biologically sound back to the common ancestor regardless of what the ethnicity pie chart says.
Where the DNA is reliable
None of this means the test is useless. It means you are reading the wrong page.
The genuinely powerful part of a consumer DNA test is the match list, not the ethnicity pie chart. If you share a long segment with another tester, you share a recent common ancestor, full stop. Matches are the tool that confirms a tree, breaks a brick wall, or reveals an adoption or a misattributed parentage. Thousands of people have found a biological grandfather, or discovered that a documented line was not biological at all, through matches.
Y-DNA and mitochondrial DNA also behave differently from the autosomal lottery. The Y chromosome passes father to son nearly unchanged, and mitochondrial DNA passes mother to child the same way. Those two lines do not fade. They are narrow, one path each out of thousands, but along those paths they reach back thousands of years, which is why Y-DNA surname projects can test whether two families with the same name share a male ancestor.
How to hold both in your head
The family tree records who had children with whom. That is a historical fact and documents are the right tool for it. The DNA records which segments survived the shuffle. That is a biological fact and the lab is the right tool for it. They answer different questions.
When the two disagree, work through it in order. First, is the ancestor far enough back that zero inheritance is plausible? Six generations or more, probably yes. Second, is the ethnicity label even distinguishable from its neighbors? If the “missing” ancestry is Irish and you have plenty of “British,” the segments may simply have been sorted under the wrong flag. Third, do the matches support the line? If you match other documented descendants of that Irish ancestor, the line is biologically real whether or not the pie chart says so. Only if the matches are absent across the whole branch should you start asking whether a paper link is actually a biological one.
The tree and the test are not competitors. One is a map of relationships. The other is a sample of what those relationships happened to leave behind in you.
Sources
- Coop, G. (2013). “How many genetic ancestors do I have?” gcbias (UC Davis).
- Bettinger, B. (2013). “Understanding Autosomal DNA With Just a Few Basic Tenets.” The Genetic Genealogist.
- Chang, J. T. (1999). “Recent common ancestors of all present-day individuals.” Advances in Applied Probability 31(4).
- Rohde, Olson, and Chang (2004). “Modelling the recent common ancestry of all living humans.” Nature 431.
- Larmuseau, M. et al., on extra-pair paternity rates from Y-chromosome genealogies (KU Leuven).
Image credits
- W. L. Germon, [Family Portrait], ca. 1855, salted paper print with applied media. The Metropolitan Museum of Art, CC0.
- T. H. Morgan, A Critique of the Theory of Evolution (1916), fig. 64. Wikimedia Commons, Public domain.
